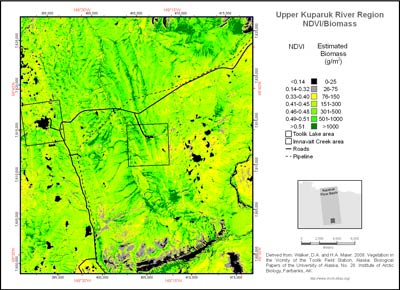
Upper Kuparuk River Region NDVI and Phytomass
- Upper Kuparuk
- Vegetation
- SPOT
- Elevation
- Hydrology
- NDVI and Phytomass
- Landforms
- Glacial Geology
- Surficial Geology
- Surficial Geomorphology
- Literature
| Available data: | ||||
 |
 GE |
 Metadata |
 GIS data |
 GIS data |
NDVI is an index of vegetation greenness that can be linked to plant biomass and other biophysical properties of the vegetation, such as CO2 and photosynthesis. The NDVI = (NIR - R)/(NIR + R), where NIR and R are the spectral reflectance values of the near-infrared (790-890 nm) and red (610-680 nm) bands, respectively. This map is derived from the same SPOT data as the Upper Kuparuk Region False-Color Infrared Image. It is modified from an earlier version (Shippert et al. 1995) using more recent biomass information (Walker et al. 2008). Water and barrens are generally displayed as black. Dry tundra and sparsely vegetated areas are displayed in gray. Vegetation density increases with darker shades of green.
 |
|
| The University of Alaska Fairbanks is an affirmative action/equal opportunity employer and educational institution. | |
|
Loading
| |
Last modified: January 17, 2012